
Case study
Settling a 60 year argument with data
Every football conversation ends up in the same place: who was better? The problem is that the argument is usually unwinnable, because the evidence is incomparable. Pelé played in a different game, in a different era, against different defences, with different competitions on offer.
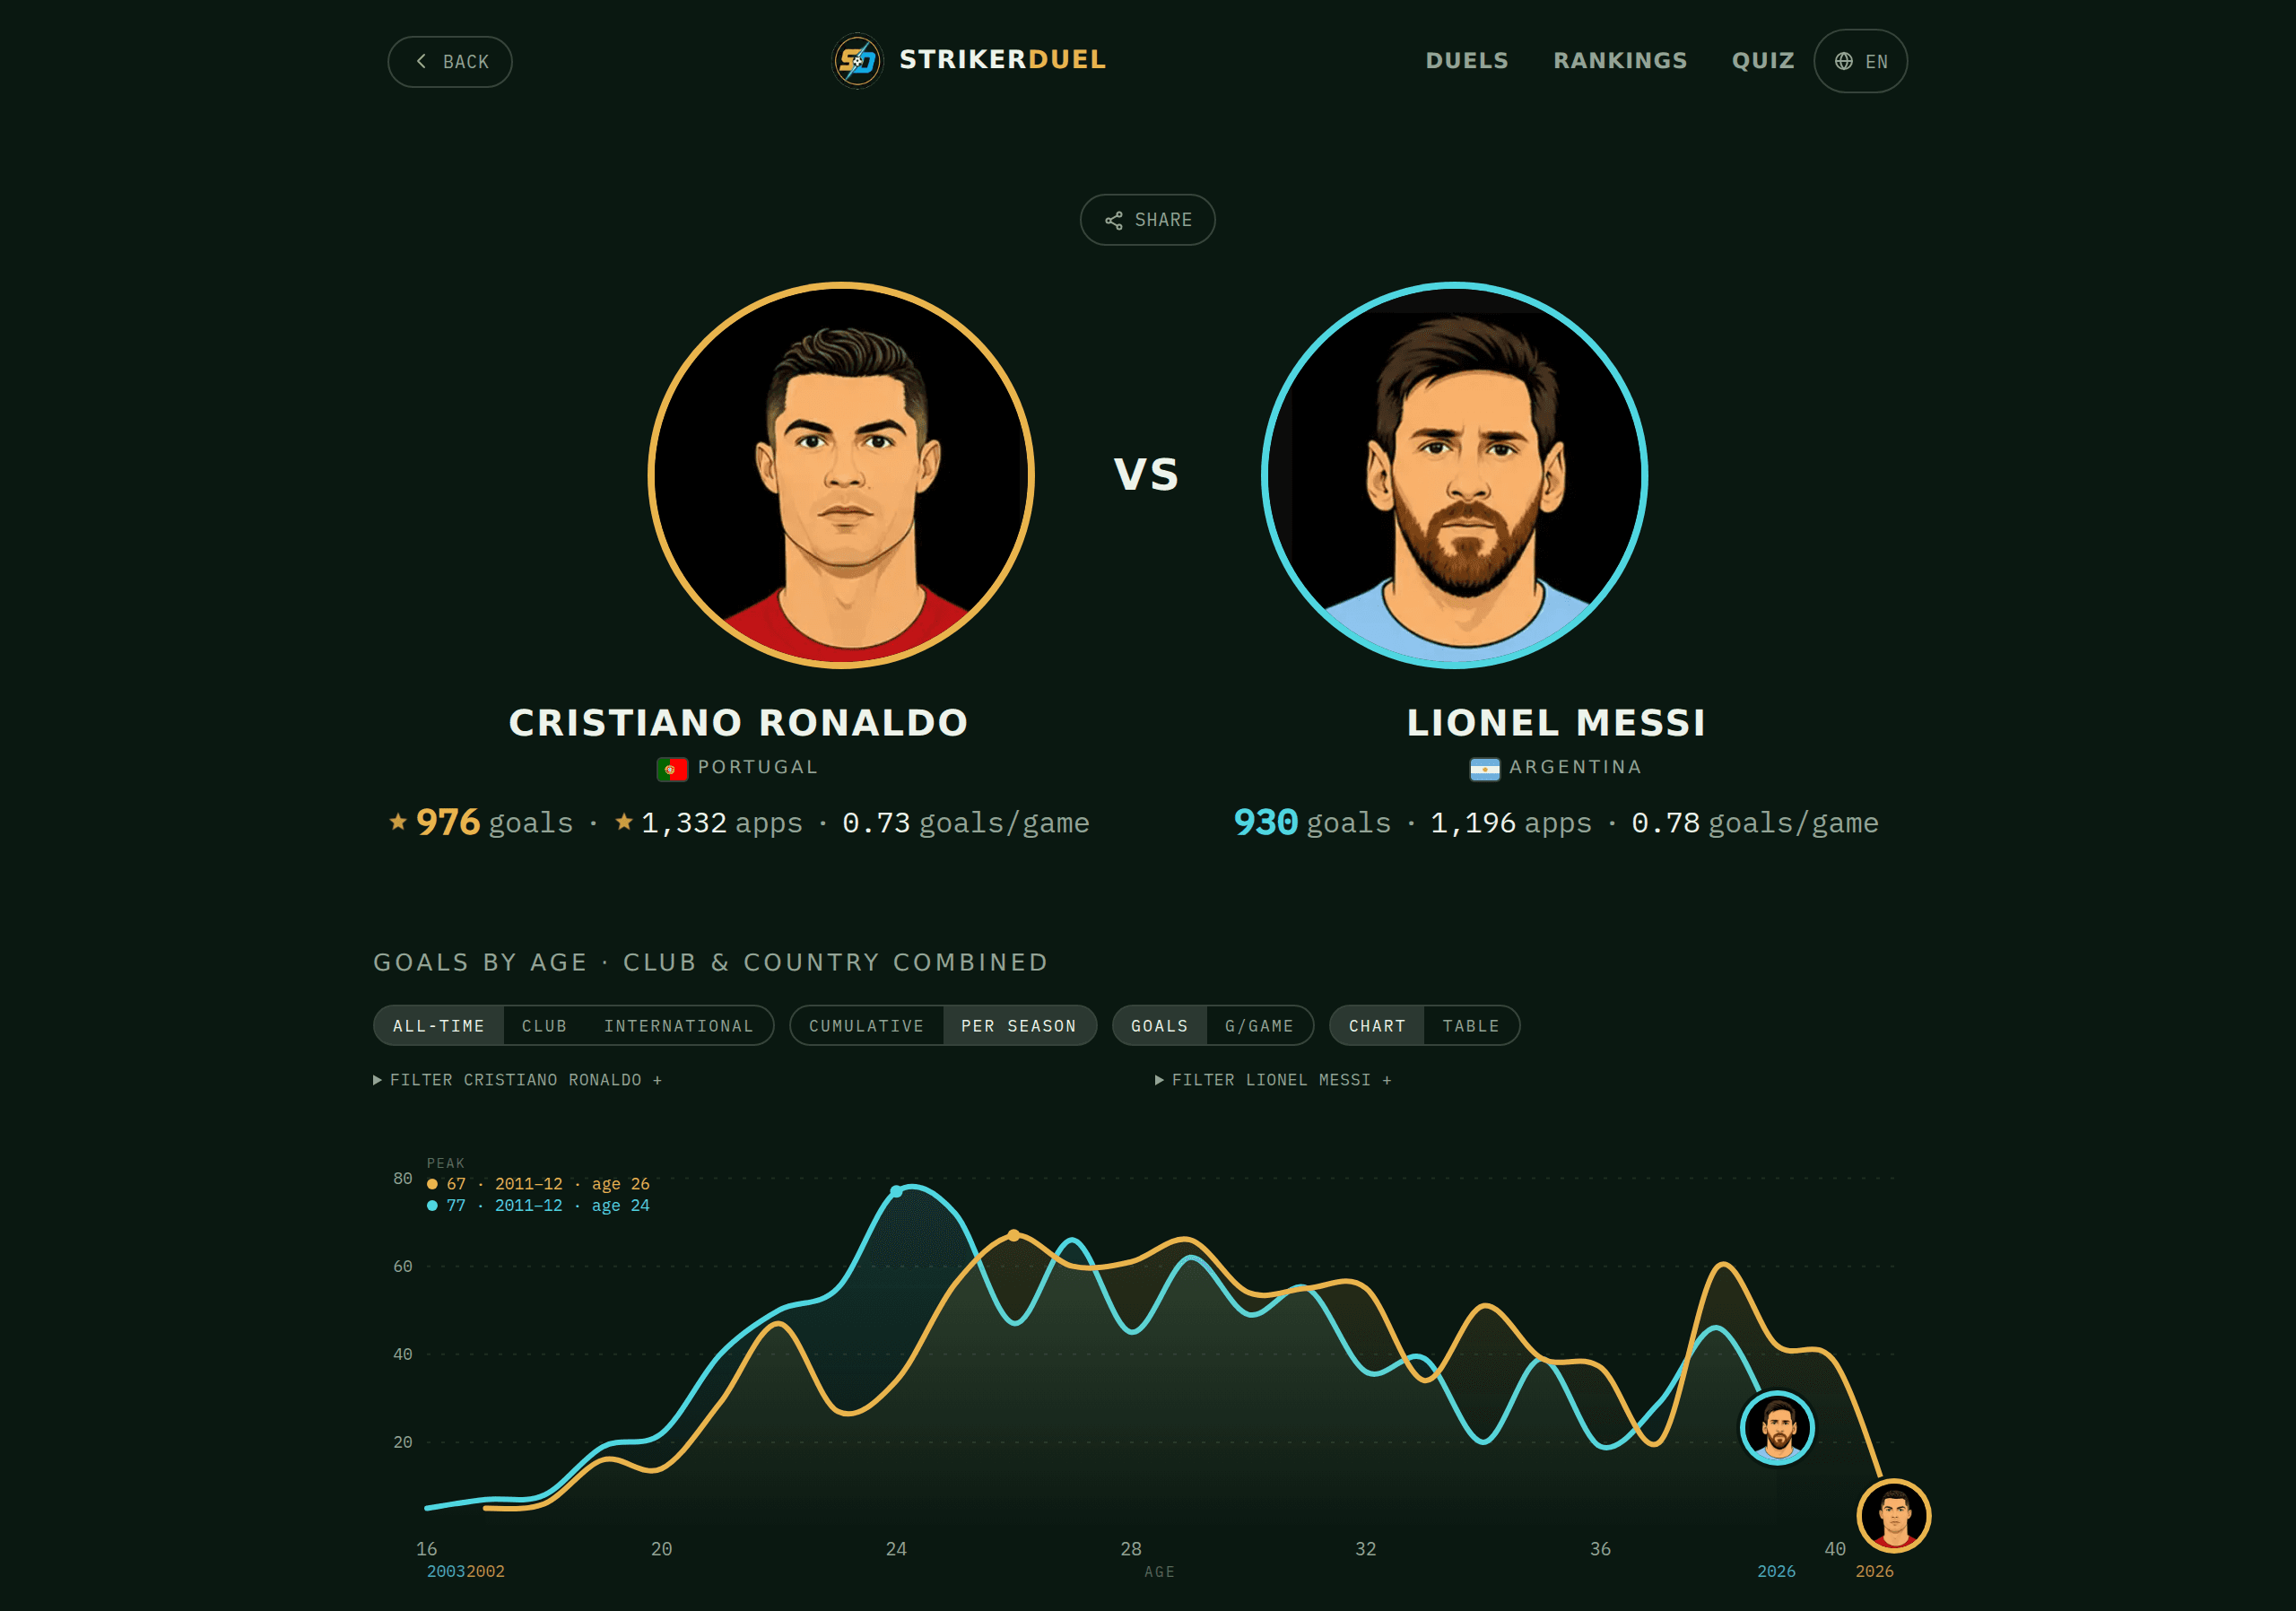
StrikerDuel is an attempt to make that argument answerable. Pick any two of 134 elite forwards from the 1960s to today and see their careers side by side, aligned by age rather than by calendar year.
The problem
Football statistics are abundant and almost useless for comparison. Three things break every naive attempt.
Eras do not line up. Comparing a 1974 season to a 2024 season tells you almost nothing. Comparing what two players did at 23 tells you a great deal.
Honours are not comparable. A Ballon d'Or in 1968 is not a Ballon d'Or in 2018. The European Cup became the Champions League. Some competitions vanished, some were invented, and confederations count them differently. There is no off the shelf taxonomy that lets you put two trophy cabinets next to each other honestly.
The source data is a mess. Pre-1990s appearance records are incomplete. Sources disagree. Unofficial matches are sometimes counted, sometimes not. Any product built on this data has to make hundreds of explicit editorial decisions and then be honest about them.
Existing sites are either reference databases that dump raw tables at you, or opinion content with no data underneath. Neither settles anything.
The approach
Age-aligned career modelling
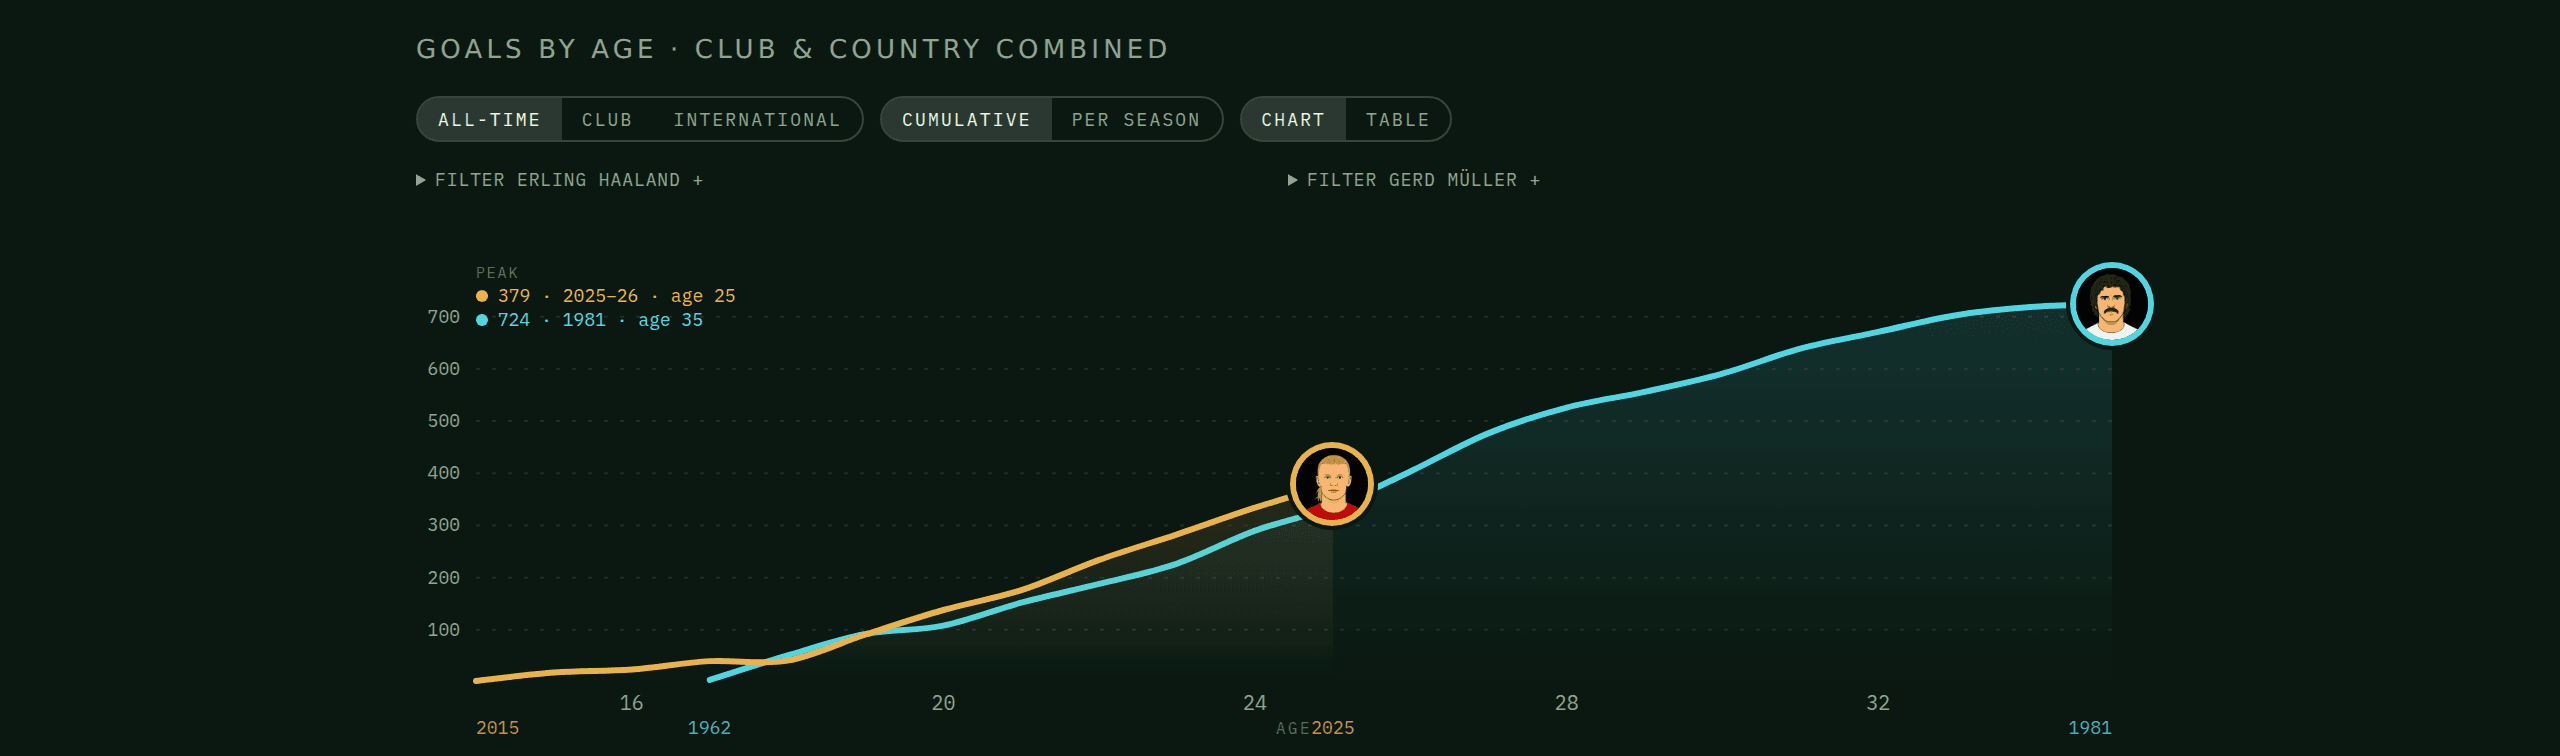
The core design decision. Careers are overlaid season by season at the same age, not the same year. It sounds simple. It requires resolving mid-season birthdays, partial seasons, loan spells, youth team appearances and international windows into a single consistent timeline model per player.
The result is a chart where you can read a 1970s striker directly against a current one, on the same axis, without any hand waving.
A normalised honours taxonomy
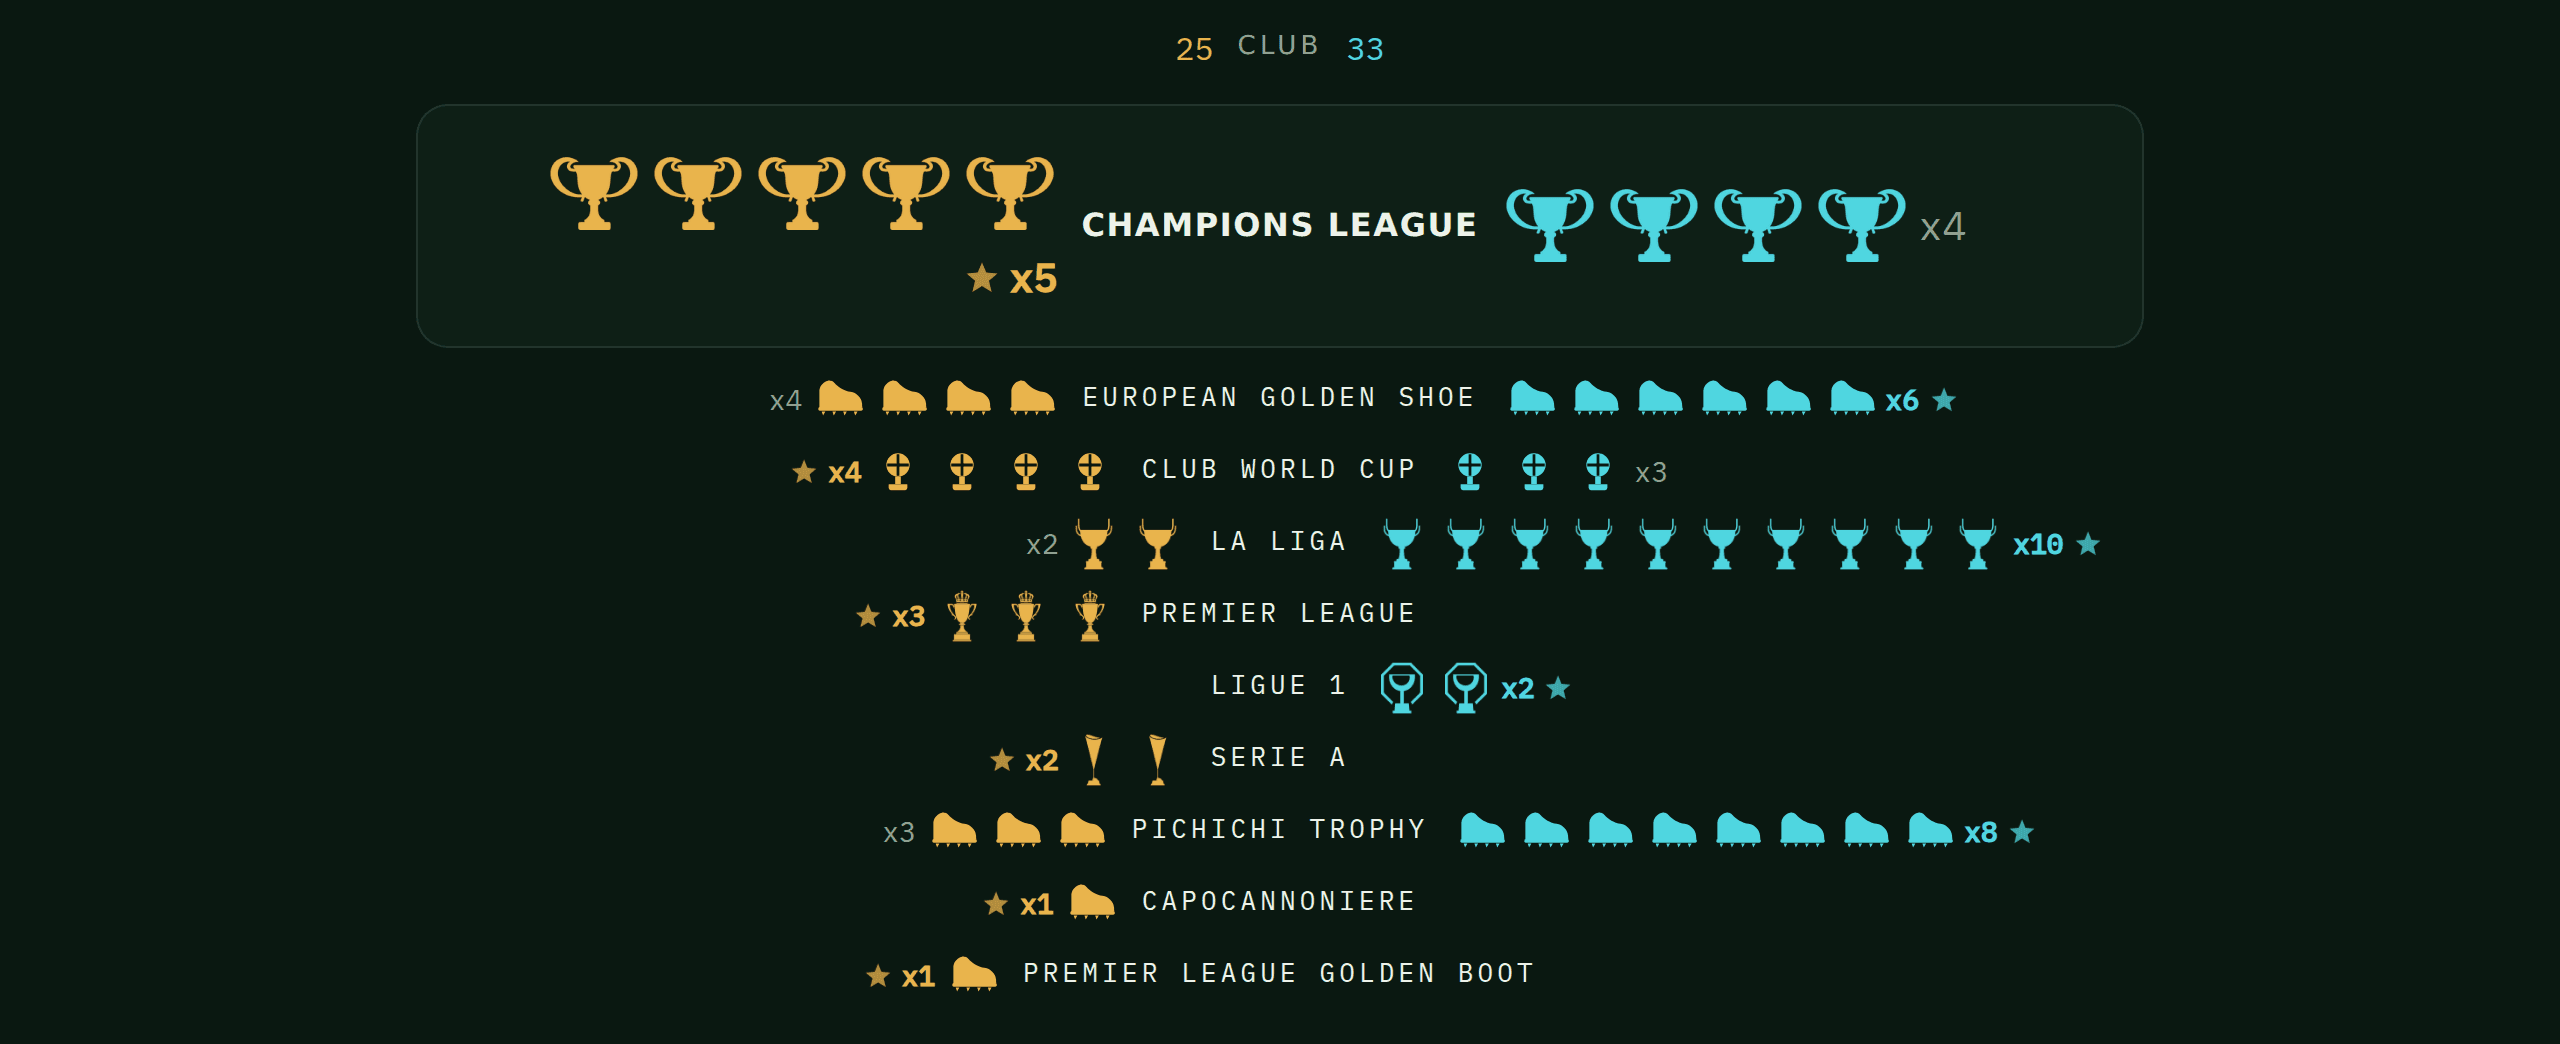
Every award, league title and continental cup was mapped to a canonical ID with a type classification, then grouped into international, club, team and individual tiers. This is the least glamorous and most valuable part of the build. It is what lets the trophy cabinets sit next to each other and mean something.
A pipeline that assumes the data is wrong
Career statistics are compiled from public sources, primarily per-season club and international tables, then normalised through a Python pipeline and reviewed by hand before publishing. Where sources conflict, official competition totals are preferred and gaps are noted rather than guessed.
Every player carries a visible last-updated date and a link to the source. If the data is imperfect, the honest move is to say where and why, not to project false confidence.
Built to be found
The comparison itself is only useful if people reach it. The architecture treats search as a first class requirement.
- Statically generated pages per matchup, each with stat-forward titles and descriptions built from real numbers.
- Dynamically generated Open Graph images per route, so any shared duel renders as a proper card rather than a bare link.
- Selective sitemapping, because a combinatorial page space needs curation, not brute force.
- A published methodology page with source attribution, because credibility is a ranking factor and also just the right thing to do.
Stack
| Layer | Choice | Why |
|---|---|---|
| Frontend | Next.js (App Router), Tailwind CSS | Static generation across a large page space, per-route metadata and OG image generation |
| Data viz | Hand-built SVG with Motion | Age-aligned timelines with per-club filtering and cumulative or per-season toggles, without shipping a charting library to every visitor |
| Internationalisation | next-intl | Localised routes and a translated honours taxonomy on the same domain, with every English URL left untouched |
| Data pipeline | Python | Source parsing, normalisation, taxonomy mapping, validation |
| Hosting | Vercel | Edge delivery, preview deploys, zero infrastructure overhead |
What it does now
- 134 profiled forwards, 1960s to present
- Head to head duels with age-aligned goal timelines, filterable by club and competition
- Normalised honours comparison across eras
- Multiple ranking tables that update automatically as the roster grows
- An interactive quiz
- Spanish, Portuguese and Indonesian editions on the same domain
What I would tell you about your own project
StrikerDuel was built to answer a specific question well, and the interesting work was not the interface. It was deciding what the data actually supports, being explicit about the gaps, and designing an architecture where adding the 134th player is a data change rather than a code change.
That is usually the shape of the problem. The visualisation is the visible part. The value sits in the modelling underneath it, and in being disciplined about what you are willing to claim.